Stewardship -

Raw Materials Characterization

ExxonMobil

Business Line


Fuels & Lubes

Design Team

Design Strategy

Project Type

Opportunity Identification

Project Length

3 Months

Name of the project

Organization / Business Line
Opportunity Identification
Billing Code
Started on: 6th January 2025
Last updated on: 23rd April 2025

My Role

Lead Product Designer: Led discovery, defined UX strategy, and designed dashboard concepts for complex data workflows.

Objectives

This project at ExxonMobil focused on improving how raw materials data is accessed and used, uncovering $10M–$150M in potential annual value.

What is the benefit for the business?

ExxonMobil leverages opportunity identification to enhance business efficiency, innovation, and sustainability, driving competitive advantage in the energy sector. By analyzing market trends, technological advancements, and customer needs, the company uncovers new growth areas, such as low-carbon solutions, digital transformation, and operational optimization.

What is the benefit for the user?

For users, this translates into reliable energy supply, cost-effective products, and cleaner technologies—meeting evolving demands while reducing environmental impact. Proactive opportunity identification ensures ExxonMobil stays ahead in energy transition, benefiting industries, consumers, and stakeholders with innovative and sustainable solutions.

Overview

Raw Materials Characterization

ExxonMobil employs advanced techniques for Raw Materials Characterization to ensure quality and performance in its products. The company utilizes cutting-edge analytical methods, such as spectroscopy, chromatography, and rheology, to assess the chemical and physical properties of crude oil, natural gas, and petrochemical feedstocks.

By rigorously testing raw materials, ExxonMobil optimizes refining processes, enhances product consistency, and maintains compliance with industry standards. Their expertise in material science enables efficient resource utilization and supports innovation in energy solutions.

Challenge

Different functions across the value chain feed, receive, and rely on detailed data around the molecular make-up of raw materials (ex: crudes). This complex process, enabled through proprietary technology, is considered a critical competitive advantage for ExxonMobil. However, the Business wanted to know if value was left on the table. We were brought in to conduct a holistic deep dive to uncover opportunities for value creation.

Problem

Data was siloed, difficult to interpret, and disconnected across systems, leading to slow and inconsistent decision-making.

Solution

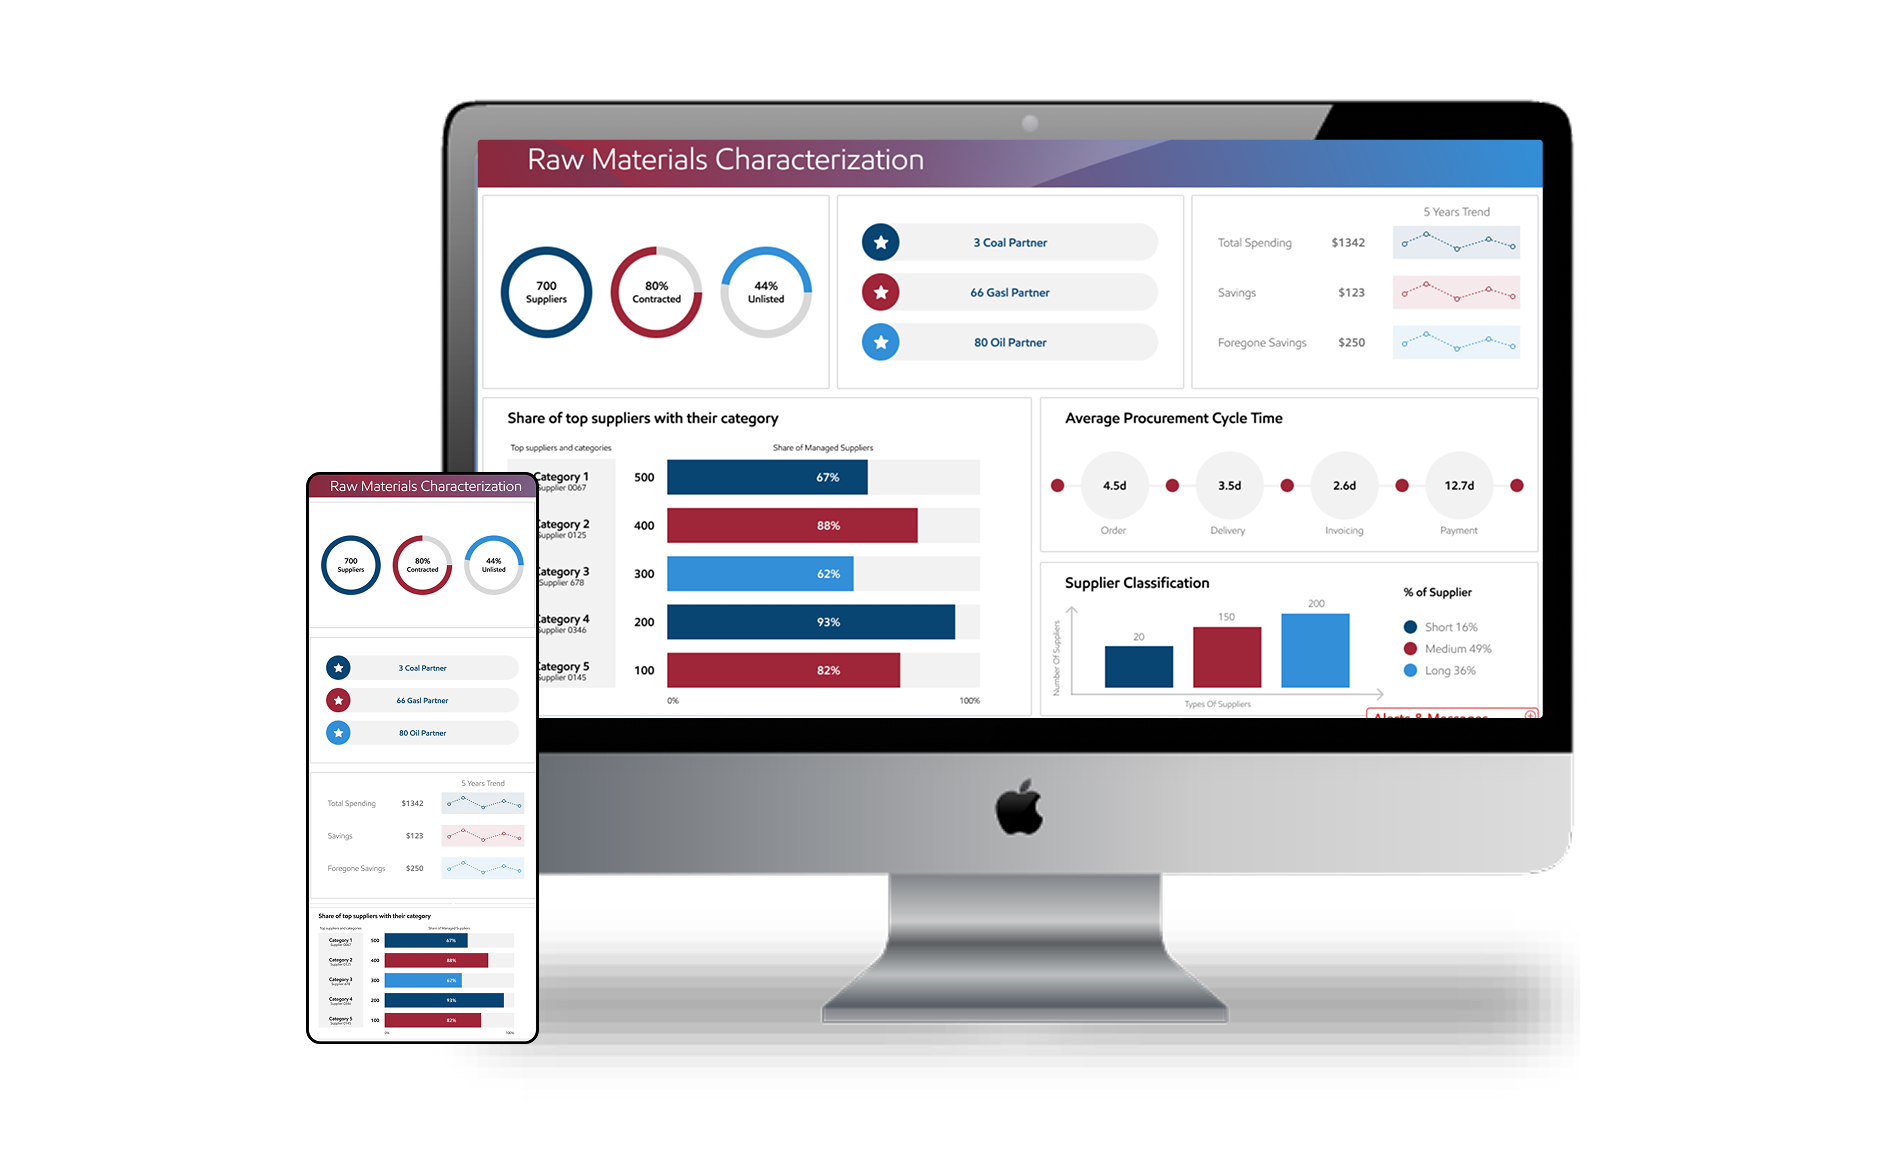
Designed a unified dashboard with real-time visibility, comparison tools, and actionable insights.
Challenge Section Image

Payments & Rewards

Challange

We wanted to make a safe and easy way to digitally pay for fuel and earn loyalty points right at the pump. The prior innovative method of payment, the SpeedPass dongle was becoming outdated and too costly to maintain and ExxonMobil needed a new way for customers to pay for fuel that matched the ease-of-use and security of Speedpass.

Solution

We worked closely with Payment and Loyalty Solutions Operation (PLSO), Fuels Marketing, and the vendors to identify needs of both the business and our consumers so as to create an experience like no other when purchasing fuel and earning rewards while at our sites.

Impact

  • $10M–$150M annual opportunity identified through improved data visibility and decision-making

Constraints

  • Legacy systems, data silos, and proprietary models limited implementation flexibility

Design Strategy

  • Surface hidden data – Enable faster decisions – Connect systems

Key Insights

  • Data existed but was not accessible – Interpretation varied across teams – No unified view of value

Design Process

The design process section is a crucial part of your UI/UX case study. It showcases your problem-solving methodology and the steps taken to arrive at the final design solution.
E dp1

Emphasize

User Research User InterviewCompetitive Analysis

E dp2

Define

User Persona Goal Statement Empathy Map

E dp3

Ideate

Brainstorming Card SortingUser Flow

E dp4

Design

Paper Wireframes Visual Design Prototype

E dp5

Test

Check Usability Survey Insight Improvements

Empathy Map

Think Feel

"Inconsistent raw material quality delays production."

Efficient testing reduces costs and waste.

Limited data sharing between suppliers and labs.

Hear

We need faster test results to meet production schedules

The current methods are too manual and error-prone.

Document all characterization data for audits.

See

Spreadsheets/manual records for data tracking.

Demand for sustainable/eco-friendly materials.

Shift toward AI-driven material analysis.

Say & Do

Run repeat tests to confirm results.

Automation would cut our turnaround time in half.

Attend conferences on analytical techniques.

Participant Demographics

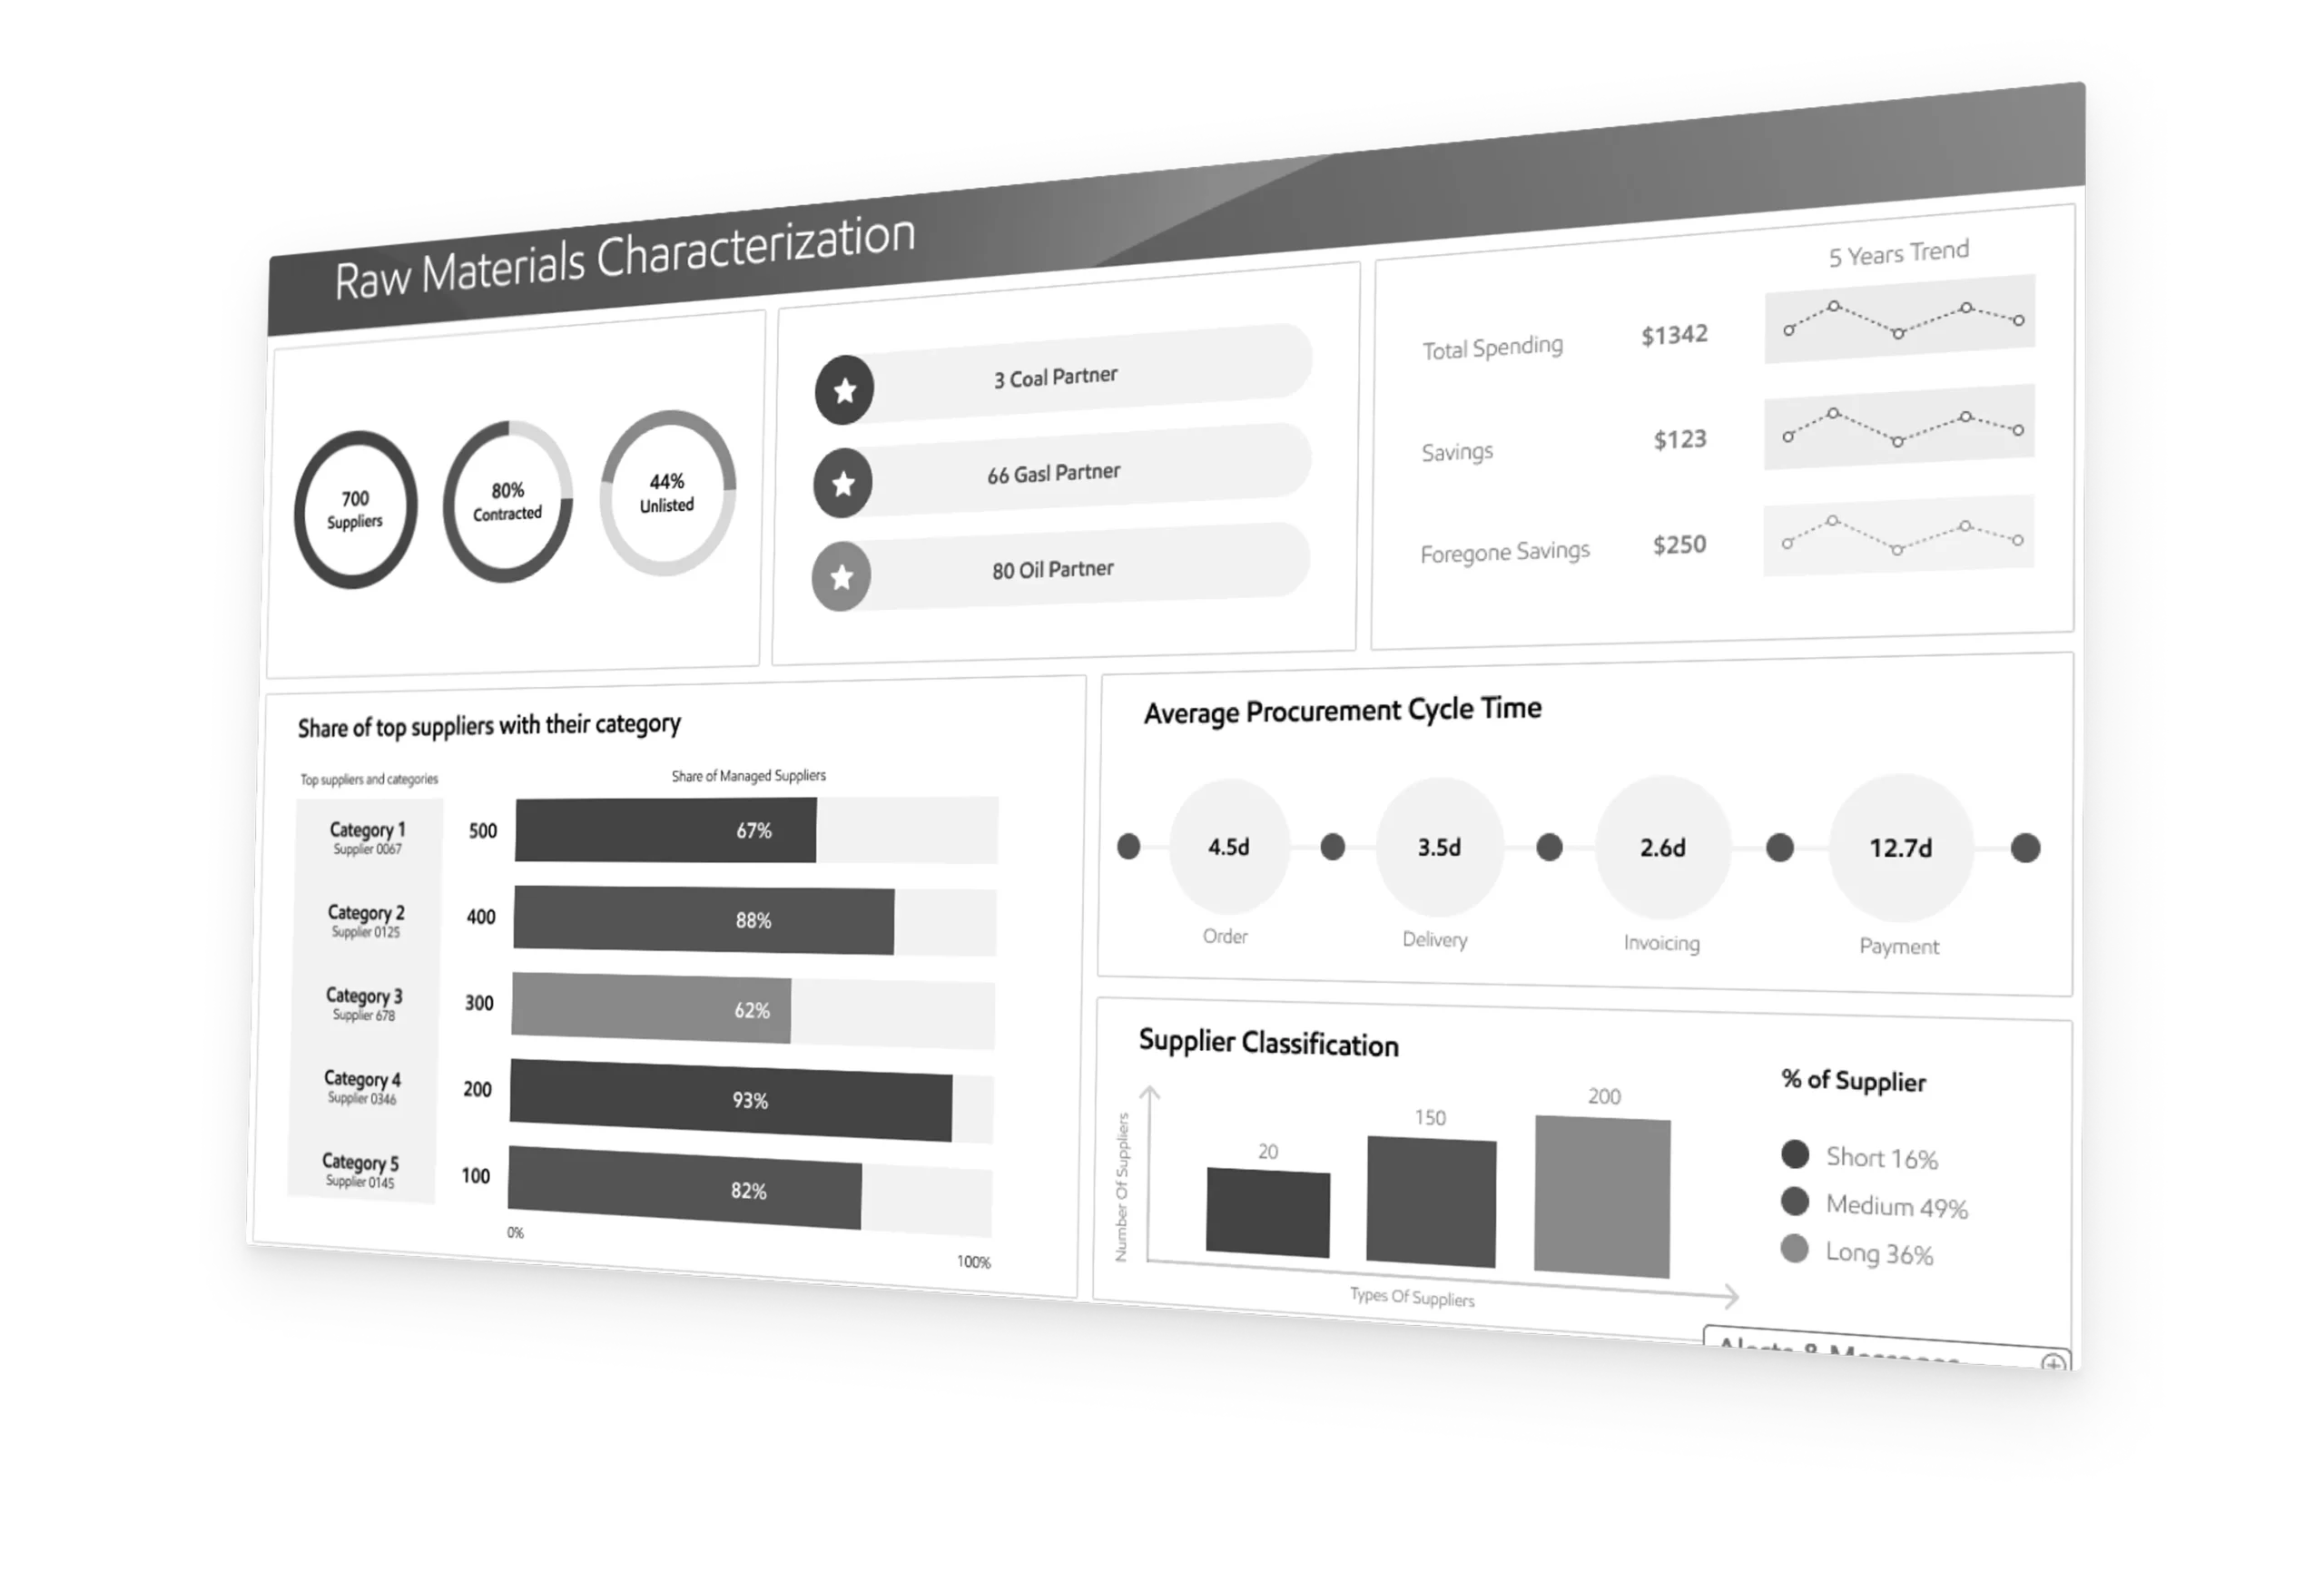
A wireframe is a rough schematic created in the early stages of digital product design to help visualize and communicate the structure of a product or website.

Users Age

Pd

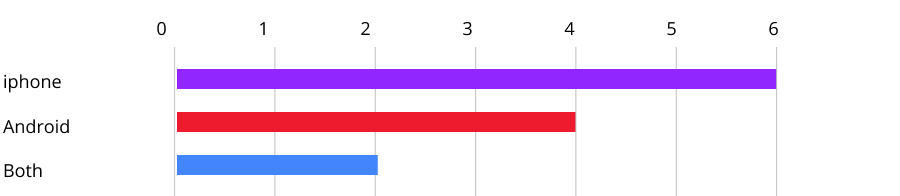
Phone Type

Pd

Internet Browser

Pd

Workplace Type

Pd

Users Group

Jeff Hardy

Jeff Hardy

Josefina Mana

Josefina Mana

Fran Ria

Fran Ria

Edmund Franco

Edmund Franco

Persona

Name

Elena Vance

Occupation

Self-employed

Persona

User Profile

Elena acts as the critical bridge between the lab, the refinery floor, and the trading desk. She possesses a PhD in Chemical Engineering and has spent 12 years understanding the molecular signatures of various crude streams. While she is a technical expert, her current mandate is to maximize margin capture by ensuring the right feedstocks go to the right assets at the right time.

Need

  • Faster, more automated analysis to reduce manual workload.
  • Standardized protocols for consistent material evaluation.
  • Reduce the time it takes to validate a new crude blend from weeks to hours.
  • A clear lineage of where the data came from, ensuring that decisions are backed by validated proprietary technology.

Pain Point

  • Time-consuming sample preparation and method development.
  • Lack of integration between different analytical instruments.
  • Current models cannot account for real-time molecular variability, forcing the company to rely on conservative, outdated averages.

Org Activity

Tech Sevy

Social Skills

Testing Methodology

  • Platform: Web-based dashboard (tested on Chrome, Edge, and Firefox)
  • Participants: 8-10 users (mix of experienced and novice lab personnel)
  • Session Duration: 45-60 minutes per user
  • Testing Type: Moderated remote/in-person sessions + task-based scenarios

Key Metrics Evaluated

This usability test ensures the Raw Material Characterization Dashboard is intuitive, efficient, and aligned with lab workflows before rollout.

Low fidelity wireframe

Low fidelity wireframe

User Interface

User Interface

Key Learning

Data only creates value when it is accessible, interpretable, and actionable

Wanna collaborate?

Let’s chat.

Hey, thanks for checking out my work.

I’ve been fascinated with the way people interact with technology since forever. I’m particularly keen on digital products designed to make life easier for human beings.

What are you working on?

If you want to know more about my design process, or if you want to talk about a cool idea, don’t hesitate to hit me up.