Stewardship -

Tire Sense & Tire Inspection System

Business Line


Fuels & Lubes

Design Team

Design Strategy

Project Type

Service mapping, Web Application 
Development

Project Length

2 Months

Name of the project

Implementation of Tire Sense & Tire Inspection System

Objectives

Tire quality process control is a complex process and each manufacturer defines his own specific requirements.

In order to have an automatic inspection system, the ultimate goal is not only to detect defects, but to classify them according to their severity (or criticality).

Tire inspection systems offer numerous benefits for both users and businesses. For users, they improve safety by identifying issues like low tread depth and damage, leading to safer driving and preventing accidents. 

For businesses, they enhance efficiency through faster, automated inspections, reduce costs by minimizing downtime and wear and tear, and improve compliance with regulations. 

Objectives right image

Benefits for Users

Enhanced Safety

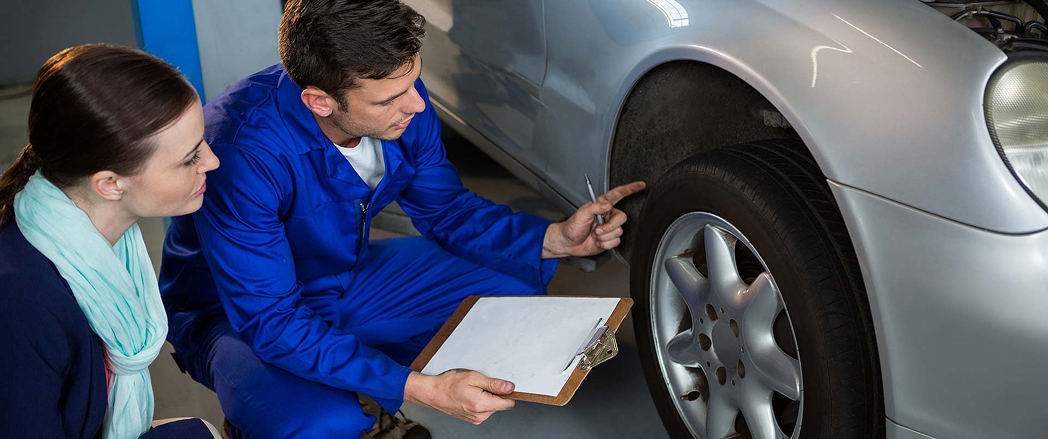
Tire inspections help identify critical issues like low tread, bulges, cracks, and punctures, which can compromise tire performance and safety. Early detection allows for timely replacement or repairs, preventing potential accidents, especially in wet or icy conditions.

Cost Savings

Regular inspections can help identify issues early, preventing them from escalating into more costly repairs or premature tire replacement. This can save users money in the long run by minimizing unexpected maintenance costs.

Improved Vehicle Performance

Properly maintained tires ensure better handling, braking, and overall vehicle performance. Inspections help identify issues that can affect vehicle stability and control, contributing to a safer and more enjoyable driving experience.

Peace of Mind

Knowing that your tires are in good condition provides peace of mind, allowing you to drive with confidence and enjoy the road without worrying about potential tire failures.

Benefits for Businesses

Increased Efficiency

Automated tire inspection systems can drastically reduce inspection times compared to manual methods, freeing up valuable time and resources for other tasks.

Lower Maintenance Costs

Regular tire inspections help prevent costly repairs and premature tire replacement, reducing overall maintenance expenses for the business.

Improved Fleet Management

Tire inspection systems provide valuable data on tire health, wear, and performance, enabling businesses to optimize tire management strategies, such as tire rotation and replacement schedules.

Reduced Downtime

By identifying potential tire issues early, businesses can proactively schedule repairs or replacements, minimizing downtime and ensuring that vehicles stay on the road and operational.

Compliance with Regulations

Many businesses, especially those with large fleets, are required to comply with specific tire inspection regulations. Automated systems can help streamline the inspection process and ensure compliance, minimizing the risk of penalties or legal issues.

Enhanced Customer Service

In industries like car rental and transportation, tire inspections ensure that vehicles are in safe and reliable condition, contributing to a positive customer experience.

My Role

  • Product Designer
  • Led UX strategy and service design
  • Designed monitoring and booking experience

Goal

  • To make users’ vehicle service experience comfortable by providing them with online booking.
  • To decrease their efforts to pick up and drop vehicles at service centers by providing them with pickup and drop facilities.
Goal Section

Challenge

Tire health contributes significantly to driving safety and sustainability, but manufacturers and retailers have infrequent touchpoints with consumers. We were tasked with mapping and designing a service that would empower drivers to better manage their tires and thus improve performance. Without access to the actual service location during the global pandemic, we had to creatively uncover consumer behaviors and perceptions that would ultimately inform how to increase adoption of the proposed solution.

Problem

  • Missed defects due to manual checks
  • No real-time visibility
  • Long service delays
  • High safety risks

Solution

  • Real-time tire monitoring system
  • Smart alerts
  • Integrated service booking
  • Fleet dashboard
Pain Point

Pain Point

  • Users often neglect regular checks due to inconvenience.
  • Unnoticed Uneven Wear Leads to Costly Repairs
  • Under/Over-Inflated Tires Cause Safety Risks
  • Incorrect pressure leads to poor handling, blowouts, or reduced fuel efficiency.
  • No Predictive Maintenance Alerts
  • Difficulty Finding Reliable Tire Service

Features

  • Comprehensive Tread Depth Measurement
  • Real-Time Tire Pressure Monitoring
  • AI-Powered Wear Analysis
  • Wireless & Automated Scanning
  • Multi-Point Inspection
  • Cloud-Based History & Alerts
  • Integration with Fleet Management

Why It Matters

  • Unplanned failures increase costs
  • Downtime impacts operations
  • Drivers lack awareness of tire health

Key Insight

  • Users don’t need inspections
  • They need continuous awareness

Design Principles

  • Shift to proactive monitoring
  • Reduce service friction
  • Make data actionable

Core Experience

  • Detect issue → Alert → Book → Service → Return

Key UX Decision: Dashboard

Monitoring:

  • Live tire data visibility
  • Reduces uncertainty
  • Prevents failures early

Service Flow:

  • Seamless booking
  • Pickup and drop service
  • Reduced user effort

Alerts:

  • Actionable notifications
  • Prioritize urgency
  • Guide next steps

Impact

  • Improved safety awareness
  • Reduced manual inspections
  • Faster service turnaround

Constraints

  • Sensor accuracy vs cost
  • System complexity
  • User simplicity vs data depth

Tire pressure

Tread depth

Alerts Design

Before: Static Monitoring

  • Displays current PSI as a raw numerical value for each tire
  • No distinction between a natural pressure drop and a rapid leak
  • Data is delayed or only updated at specific check-points
  • Pressure is viewed in isolation from tire temperature

After: Dynamic Load-Adjusted Insights

  • Automatically compares current pressure against a “Load-Adjusted Target”
  • Highlights tires losing air faster than the fleet average, even if they are still within “safe” limits
  • Normalizes pressure readings against outside temperature to prevent “false positive” alerts
  • Uses color-coded backgrounds (muted green vs. high-saturation orange) to prioritize attention

Before: Manual Logging

  • Relies on manual “penny tests” or handheld gauges logged once a week
  • Depth is recorded as a single static number in a spreadsheet
  • No visualization of uneven wear (inner vs. outer shoulder)
  • Replacement is scheduled based on “tread limit” only, often too late
  • Data is historical and rarely accessible to the driver in real-time

After: Automated Wear Modeling

  • Uses computer vision or sensors to project exactly how many days/miles of life remain based on current wear rates
  • Visualizes profiles to identify alignment or suspension issues
  • Adjusts “safe depth” thresholds based on the current field terrain
  • Triggers a “low tread” flag directly to the shop to ensure a replacement tire is in stock before the vehicle arrives

Manual Inspection vs. Automated Sensors

Before: Manual Inspection

  • Inconsistent data: Inspections happen on different schedules and vary in thoroughness depending on the technician
  • Lagging indicators: Safety issues are only caught after they become visible, missing internal structural degradation
  • High risk exposure: Technicians must enter high-traffic zones or crawl under heavy machinery to check tire health manually

After: Automated Sensors

  • Continuous streams: Real-time telemetry provides a 24/7 data feed, catching pressure or temperature spikes the moment they occur
  • Sub-visual detection: High-precision sensors identify microscopic air loss and internal heat friction invisible to the human eye
  • Remote safety: Data is transmitted wirelessly to a central dashboard, keeping staff out of “red zones” and reducing site incidents

Unplanned Failures vs. Predictive Alerts

Before: Unplanned Failures

  • Reactive crisis: Work stops immediately when a tire fails in the field, causing logistics “bottlenecks” that ripple across the shift
  • Compound damage: A single tire blowout at speed often damages the wheel assembly and suspension, increasing repair costs
  • Safety hazards: Sudden failures on haul roads create immediate collision risks for other drivers and nearby ground crew

After: Predictive Alerts

  • Early warning horizon: AI models flag “probable failure” days in advance by identifying abnormal wear patterns or slow leaks
  • Actionable intelligence: Alerts provide specific instructions (e.g., “Reduce speed by 10% to manage heat”) to keep the asset safe until service
  • Fleet syncing: Automated alerts notify nearby vehicles and dispatch, ensuring the site stays clear of the compromised asset

Long Wait Times vs. Scheduled Service

Before: Long Wait Times

  • Emergency backlogs: Repairs happen on a “first-come, first-served” basis during peak failure hours, leaving machines idling for half a shift
  • Parts uncertainty: Mechanics often realize a specific tire size or part is out of stock only after the machine has been towed to the shop
  • Production paralysis: Unexpected downtime forces other machines to work double-time, increasing the risk of secondary equipment fatigue

After: Scheduled Service

  • Just-in-time maintenance: Tires are serviced during natural production lulls (like shift changes or refueling), resulting in zero net downtime
  • Pre-staged inventory: The system automatically reserves parts and labor hours based on predictive wear, so the shop is ready before the machine arrives
  • Optimized lifespan: Tires are replaced at the “economic sweet spot”—not too early to waste money, but not too late to risk a blowout

Design Process

The design process section is a crucial part of your UI/UX case study. It showcases your problem-solving methodology and the steps taken to arrive at the final design solution.
E dp1

Emphasize

User Research User InterviewCompetitive Analysis

E dp2

Define

User Persona Goal Statement Empathy Map

E dp3

Ideate

Brainstorming Card SortingUser Flow

E dp4

Design

Paper Wireframes Visual Design Prototype

E dp5

Test

Check Usability Survey Insight Improvements

Empathy Map

Think Feel

Says the manual service is costly and take too much time.

Prefers online system

Before checking anything he check pressure and balance.

Hear

He always try to find out those centre where there is less rush and the service guy must be well experienced.

Look at reviews and ratings before booking anything online.

See

In this type of idea, we also can add a option of wash. Its helpful for those who’s looking for wash their vehicles.

It saves the time of user though it's helpful for service centre they don't need to manage several vehicles at a time. In less space they can perform well.

Say & Do

"I'll believe the instant payments when I see them."

"Not worth reporting near-misses - the points never add up."

Participant Demographics

A wireframe is a rough schematic created in the early stages of digital product design to help visualize and communicate the structure of a product or website.

Users Age

Pd

Phone Type

Pd

Internet Browser

Pd

Workplace Type

Pd

Users Group

Jeff Hardy

Jeff Hardy

Josefina Mana

Josefina Mana

Fran Ria

Fran Ria

Edmund Franco

Edmund Franco

Persona: John Smith

Name

John Smith

Occupation

Self-employed

John Smith

John’s Story

John was working for a global company and did not have much leisure time as his work was taking too much time. So, to start a family, he decided to quit his job and invest his savings in a bookshop, which has been his dream since his university years. All he wants to do is be able to maintain his bookshop.

Goal

  • To maximize his satisfaction.
  • To save time by selecting time
    slots at has convenience
    his vehicle service.
  • To make has vehicle service
    experience easy and smooth.

Demographic

34 years old, lives in New York. Married with a 2-year-old child, has a middle-income level. He changed his occupation 3 years ago after getting married.

Pain Point

  • If receive bad quality product then
    the exchange process is painful due
    to lack of time.
  • Pickup and drop the vehicle at
    service centres.
  • Fear of information getting stolen
    online.

Org Activity

Tech Sevy

Social Skills

User Satisfaction Survey Results

  • 92% of technicians found the system easier than manual checks.
  • 85% of fleet managers reported better decision-making with analytics.
  • 100% of drivers felt safer with real-time alerts.

User Journey Visualization

[AWARENESS]

└─Frustration​

[DECISION]

└─Anxiety

[ONBOARDING]

└─Confidence

[DAILY USE]

└─Relief

[PROBLEM SOLVING]

└─Trust

[OPTIMIZATION]

└─Pride

Low fidelity wireframe

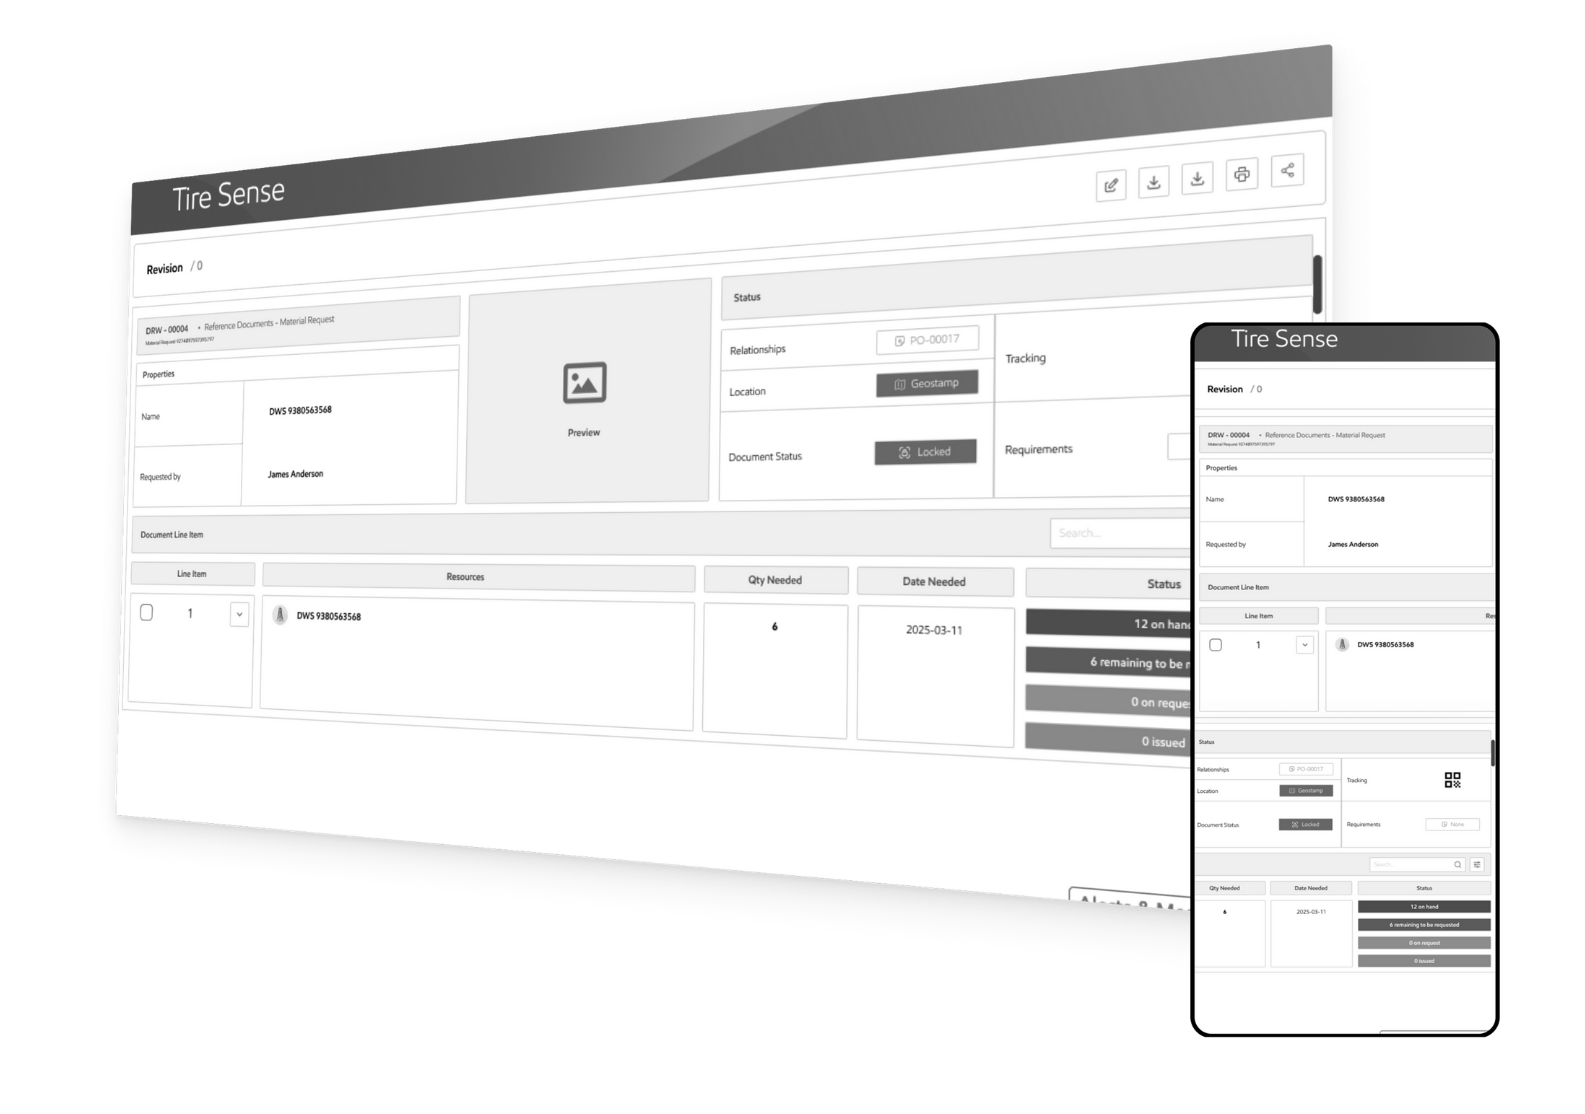
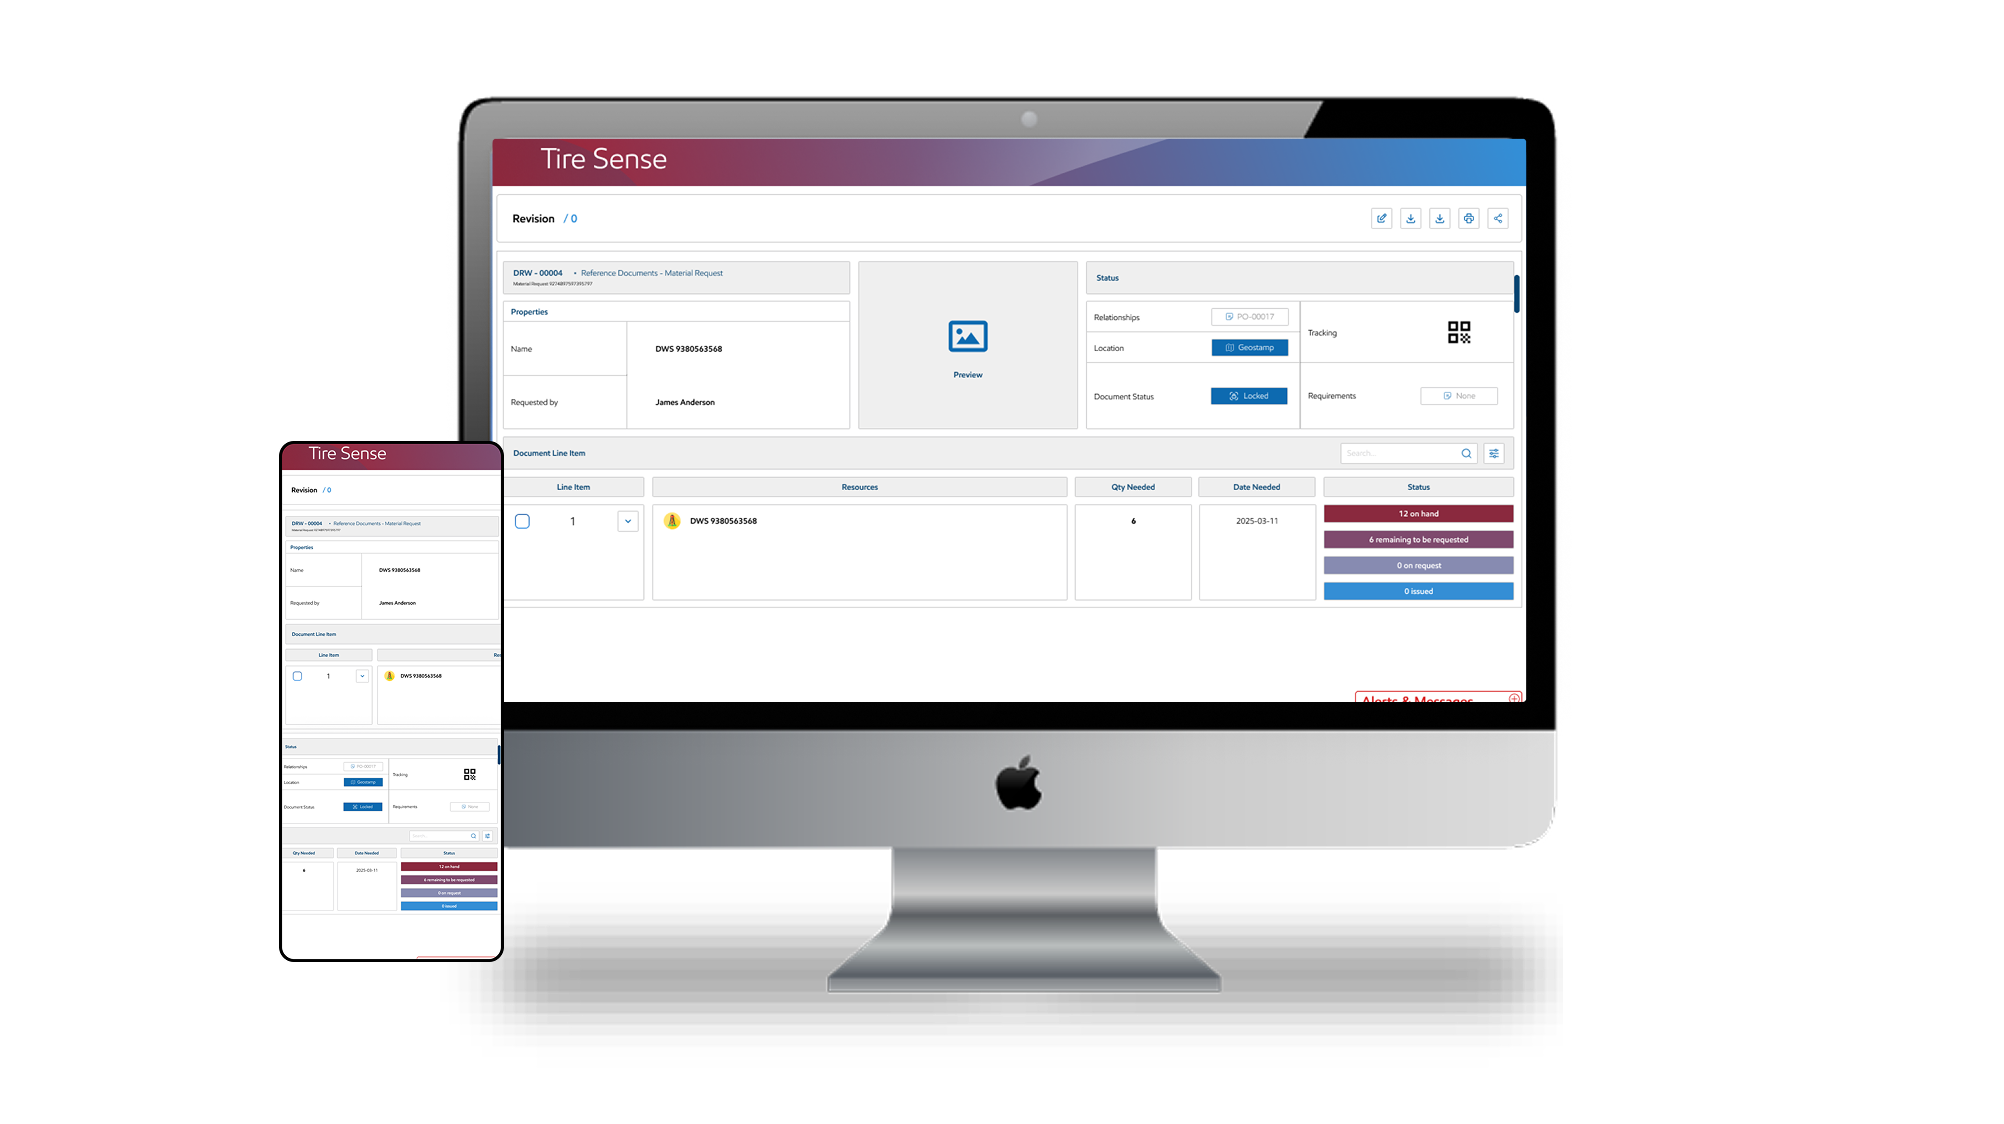
We designed a convenient and multi-point tire inspection through the use of TireSense technology, which uses a symphony of sensors to measure thread depth and pressure. The website captures and stores the data collected from the equipment and instantaneously informs drivers of their car’s tire health.

TireSense provides qualified recommendations in order to get better fuel efficiency, shorter braking distance, and improved tire life. Drivers even receive a discount voucher to purchase new tires at one of our retail partner shops to keep customers within the value ecosystem.

Wireframe of tire sense

User Interface

Tire Sense UI

Key UX Decision

  • IoT UX must simplify complex data
  • Clarity drives action
  • Proactive systems create real value

Wanna collaborate?

Let’s chat.

Name

(required)

Hey, thanks for checking out my work.

I’ve been fascinated with the way people interact with technology since forever. I’m particularly keen on digital products designed to make life easier for human beings.

What are you working on?

If you want to know more about my design process, or if you want to talk about a cool idea, don’t hesitate to hit me up.