Stewardship - Operation Hub

Business Line


Fuels & Lubes

Design Team

Design Strategy

Project Type

Web Application Development

Project Length

18 Months

Objectives

  • Reduce workplace incidents by at least 40% within one year.
  • Increase field production by 15% through automation and real-time monitoring.
  • Enhance operator decision-making with data-driven insights.

Background

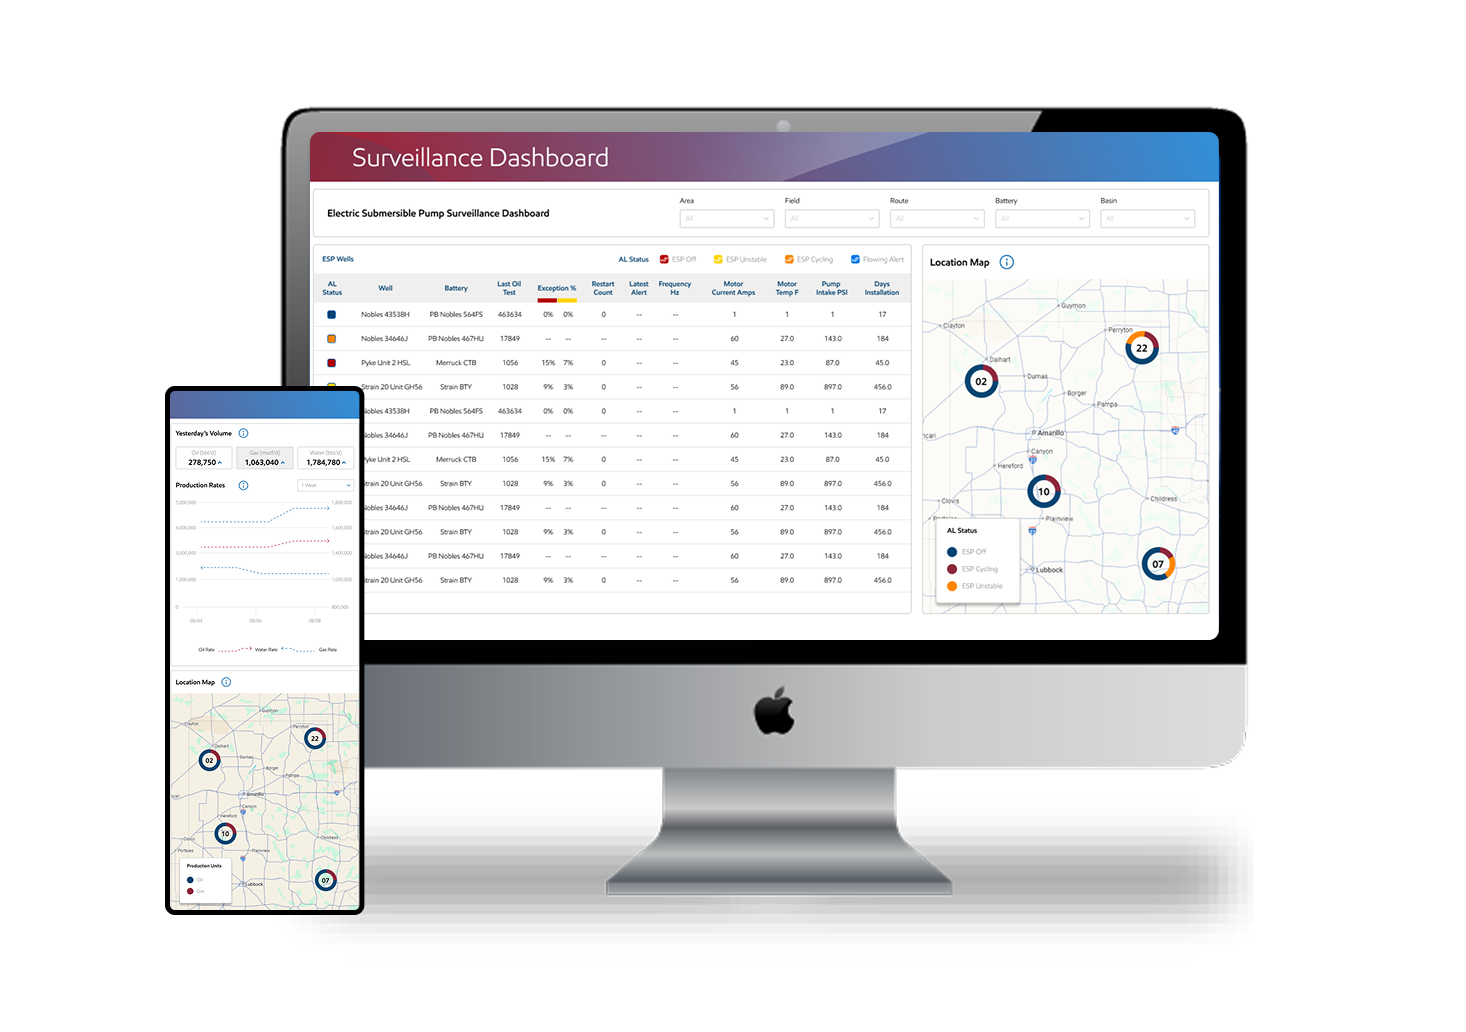
Operates multiple drilling and production sites in the Permian Basin. The company faced two major challenges:

  • Safety Concerns: High incident rates due to manual valve operations, exposure to hazardous conditions, and human error.
  • Production Inefficiencies: Delays in well monitoring and response times led to unplanned downtime and reduced output.

User Benefits (Operators & Field Personnel)

Enhanced Safety & Reduced Risk

  • Fewer workplace accidents due to automated controls and real-time hazard detection.
  • Wearable IoT devices (smart helmets, gas detectors) provide instant alerts for dangerous conditions.
  • Reduced manual interventions in high-risk areas (e.g., valve operations, high-pressure zones).

Better Decision-Making & Efficiency

  • Real-time dashboards provide critical data (pressure, flow rates, alarms) for faster responses.
  • Automated shutdown systems prevent catastrophic failures, protecting personnel.
  • Reduced physical strain from manual tasks, improving long-term health and job satisfaction.

Improved Working Conditions

  • Remote monitoring minimizes exposure to extreme weather and hazardous environments.
  • Predictive maintenance reduces unexpected equipment failures, ensuring safer operations.
  • Virtual Reality (VR) training enhances emergency preparedness without real-world risks.

Benefits for Businesses

Increased Production & Operational Efficiency

  • 15-20% higher output due to optimized workflows and reduced downtime.
  • Automated well monitoring ensures consistent production with fewer manual errors.
  • Predictive analytics prevent unplanned shutdowns, maximizing uptime.

Lower Maintenance Costs

  • Meets stricter safety regulations (OSHA, API, ISO standards) with automated compliance tracking.
  • Enhances corporate image as a leader in worker safety and sustainable operations.
  • Attracts top talent by promoting a safer, tech-driven work environment.

Cost Savings & Reduced Downtime

  • Lower maintenance costs (30-40% reduction) through AI-driven predictive maintenance.
  • Fewer safety incidents decrease legal liabilities, insurance premiums, and compensation costs.
  • Optimized workforce allocation reduces unnecessary field deployments.

Data-Driven Optimization

  • Digital twin simulations improve field layout and process efficiency.
  • AI-powered insights help in long-term reservoir management and production forecasting.
  • Integration with SCADA & ERP systems streamlines reporting and operational planning.

My Role

This project was a part of our UI/UX Bootcamp, and I applied all the methods of research I learned there. This was an individual project, so from UX research to UI designing everything was done by me. I really enjoyed working on this.

Design Process

The design process section is a crucial part of your UI/UX case study. It showcases your problem-solving methodology and the steps taken to arrive at the final design solution.

Emphasize

User Research User InterviewCompetitive Analysis

Define

User Persona Goal Statement Empathy Map

Ideate

Brainstorming Card SortingUser Flow

Design

User Research User Interview Competitive Analysis

Test

Check Usability Survey Insight Improvements

Challenge

Operators need to identify and prioritize the wells that require their direct attention. Each day, they drive the same route to check each well’s data and equipment by hand, which increases driving time and associated risk. Operators have limited data so if they need to dig deeper into an issue, they have to call foremen and supervisors to pull information across multiple applications and sources. Without real-time, integrated data, Operators may drive to a lower priority well or wait long periods of time for data collection, and miss critical situations which require immediate attention and yield increased risk.

Problem Statement

  • Manual valve operations expose workers to high-pressure hazards, leading to accidents.
  • Slow detection of gas leaks or equipment failures increases the risk of explosions or injuries.
  • Reliance on reactive safety measures (e.g., post-incident investigations) rather than proactive prevention.
  • Delayed response to equipment malfunctions causes unplanned downtime (avg. 10-20% production loss).
  • Legacy monitoring systems lack real-time data, leading to suboptimal decision-making.
  • Reactive maintenance results in costly breakdowns instead of predictive upkeep.

Solution

We created a web application in Microsoft Dynamics that delivers dashboards to promote critical information in a timely manner. They reduce the users’ time and effort required to manually build a comprehensive picture of their wells and status, driving time and risk, which can eventually lead to unscheduled downtime, potentially costing up to $2M/day. The platform provides necessary information for Operators to prioritize their routes to visit wells with issues first, and avoid unnecessary trips at critical times.

Pain Point

  • Workers exposed to hazardous valve adjustments and high-pressure zones
  • Current gas/leak monitoring systems react too slowly to prevent incidents
  • Lack of automated shutdowns leads to escalation of minor issues
  • Increasingly complex safety regulations require better documentation
  • Breakdowns occur before problems are identified
  • Field data takes hours/days to reach decision-makers
  • Difficulty attracting/retaining skilled workers in dangerous conditions

Features

  • Real-Time Well Performance Dashboards
  • AI-Powered Predictive Analytics
  • Smart Route Optimization for Field Teams
  • Automated Data Aggregation from Multiple Sources
  • Drill-Down Analytics for Root Cause Analysis
  • Customizable Alerts & Notifications
  • Compliance & Reporting Automation

Testing Methodology

  • Phase 1 (Baseline Assessment):
    • Recorded pre-SOS-PRO safety incidents & production metrics.
    • Conducted operator surveys on pain points.


  • Phase 3 (Feedback & Optimization):
    • Collected user feedback via interviews and system logs.
    • Fine-tuned alert thresholds and UI/UX of the dashboard.
  • Phase 2 (Pilot Deployment):
    • Trained operators on wearables, automated valves, and dashboards.
    • Simulated emergency scenarios (gas leaks, pressure surges) to test response times.

Empathy Map

Think Feel

"Reporting near-misses is tedious, and nothing changes."

"I’m constantly worried about leaks or equipment failures."

"Manual valve adjustments in high-pressure zones scare me."

Hear

Peers complaining about near-misses or injuries.

Alarm fatigue from outdated, false-positive sensors.

Management pushing for "faster production" despite safety concerns.

See

Aging equipment with frequent breakdowns.

Manual logbooks filled with handwritten inspections.

Say & Do

"Just get the job done—we don’t have time for safety checks."

Shortcutting procedures to meet quotas.

Participant Demographics

A wireframe is a rough schematic created in the early stages of digital product design to help visualize and communicate the structure of a product or website.

Users Age

Phone Type

Internet Browser

Workplace Type

Users Group

Field Operator

Maintenance Technician

Production Supervisor

HSE Manager

Persona

Name

Jim Carry

Occupation

Self-employed

Jim’s Story

Jim’s is a regional director who needs to catch flights a lot. He sometimes has to 7-8 times a month for work purposes. His company has assigned Jason to a specific region so that he travels to the same cities and stays at the same hotels for convenience.

Gain

  • Safety: Confidence in automated protections.
  • Efficiency: Fewer disruptions from breakdowns.
  • Clarity: Real-time data replaces guesswork.
  • Pride: Meeting production goals safely.

Demographic

28 years old, lives in Sydney. He has a middle-income level. He changed his occupation 2 years ago.

Pain Point

  • Fear of injury/death in high-risk tasks.
  • Pressure to prioritize speed over safety.
  • Lack of trust in outdated monitoring systems.
  • Paperwork overload for compliance.

Org Activity

Tech Sevy

Social Skills

Low fidelity wireframe

User Interface

Wanna collaborate?

Let’s chat

Name

(required)

Hey, thanks for checking out my work.

I’ve been fascinated with the way people interact with technology since forever. I’m particularly keen on digital products designed to make life easier for human beings.

What are you working on?

If you want to know more about my design process, or if you want to talk about a cool idea, don’t hesitate to hit me up.

thank you

To Connect with Us.