Organization / Business Line: Opportunity Identification
Billing Code:
Started on: xxxxxxx
Last updated on:
Objective
Objectives
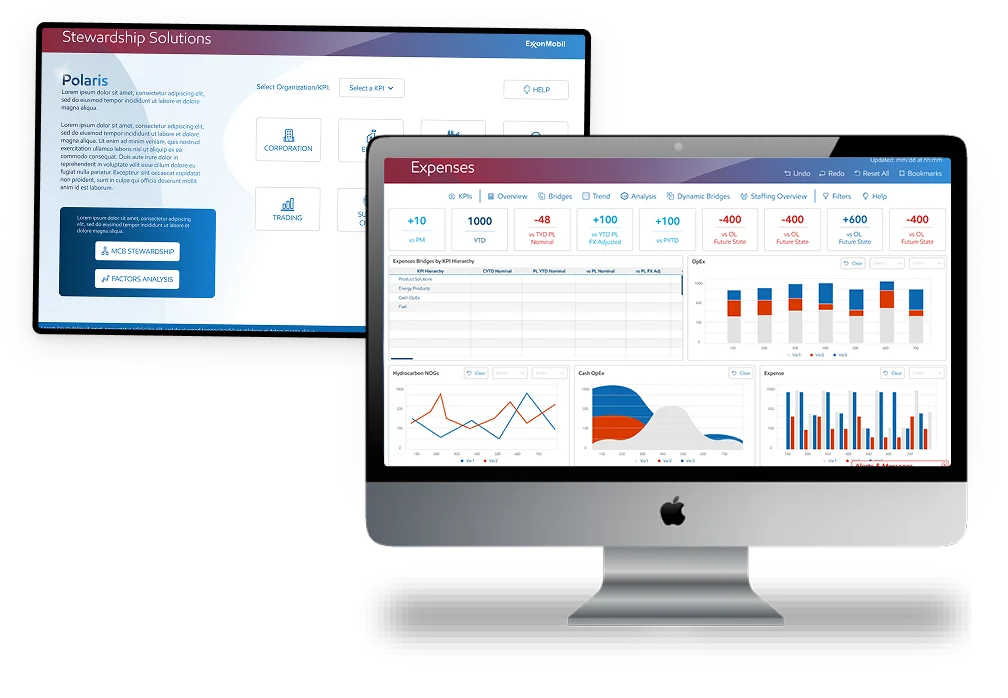
The goal is to design an intuitive, user-friendly, and highly functional dashboard that provides real-time insights into key operational metrics for oil and gas companies. The dashboard will help users monitor, analyze, and make data-driven decisions to optimize operations, improve safety, and reduce costs.
What is the benefit for the business?
ExxonMobil leverages opportunity identification to enhance business efficiency, innovation, and sustainability, driving competitive advantage in the energy sector. By analyzing market trends, technological advancements, and customer needs, the company uncovers new growth areas, such as low-carbon solutions, digital transformation, and operational optimization.
What is the benefit for the user?
For users, this translates into reliable energy supply, cost-effective products, and cleaner technologies—meeting evolving demands while reducing environmental impact. Proactive opportunity identification ensures ExxonMobil stays ahead in energy transition, benefiting industries, consumers, and stakeholders with innovative and sustainable solutions.
Raw Materials Characterization
ExxonMobil employs advanced techniques for Raw Materials Characterization to ensure quality and performance in its products. The company utilizes cutting-edge analytical methods, such as spectroscopy, chromatography, and rheology, to assess the chemical and physical properties of crude oil, natural gas, and petrochemical feedstocks.
By rigorously testing raw materials, ExxonMobil optimizes refining processes, enhances product consistency, and maintains compliance with industry standards. Their expertise in material science enables efficient resource utilization and supports innovation in energy solutions.
Challenge
Challenge
Different functions across the value chain feed, receive, and rely on detailed data around the molecular make-up of raw materials (ex: crudes).
This complex process, enabled through proprietary technology, is considered a critical competitive advantage for ExxonMobil. However, the Business wanted to know if value was left on the table.
We were brought in to conduct a holistic deep dive to uncover opportunities for value creation.
Solution
Solution
We interviewed dozens of stakeholders across Upstream and Downstream to understand current and potential usage of raw material data.
Our findings revealed hidden crude data, shallow data interpretation and decision-making, and limited use of commercial and market intelligence.
We recommended a set of opportunities ranging from $10M to $150M/year in cost-savings and new value generation.
They included optimizing refinery operations by analyzing the data mid-transport ($75-$150M/year), broadening the range of viable supply crudes ($50M/year/refinery site), optimizing purchase economics and refinery operations ($20M/year), and driving equity crude margins ($10-$50M/year).
Demographics
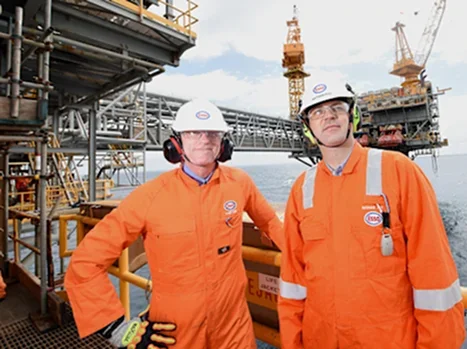
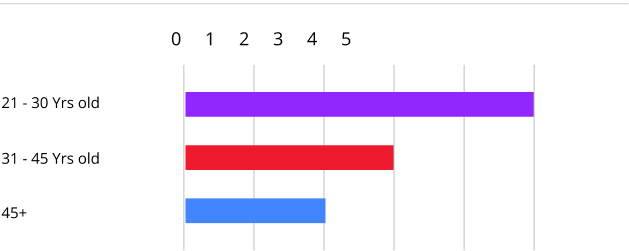
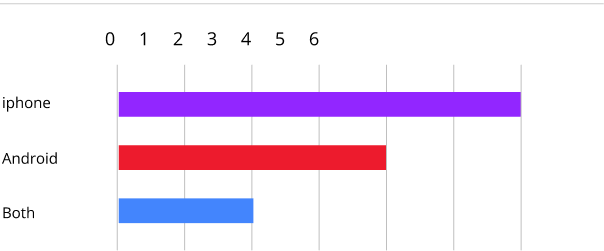
Participant Demographics
User Age
Phone Type
Internet Browser
Workplace Type
Personas
Persona: John Smith
Name
John Smith
Occupation
Control Room Operator
Org Activity
Tech Sevy
Social Skills
John’s Role
John John role is to monitor asset health, respond instantly to critical alarms, and execute precise operational adjustments to ensure peak efficiency and prevent incidents.
Demographic
34 years old, lives in New York. Married with a 2-year-old child, has a middle-income level.
User Needs
A single, unified view of operational and stewardship data.
Clear, actionable alerts with context to enable fast, correct decisions.
Intuitive navigation and efficient workflows to save time and reduce errors.
Access to reliable, real-time data on any device.
Pain Points
Data is scattered across multiple, disconnected dashboards, forcing users to piece together insights manually.
Completing simple tasks requires too many clicks and navigating through complex, non-intuitive menus.
Alerts lack context, and visualizations are confusing, leading to misinterpretation and slow response times.
The system is difficult to use on different devices and does not adequately support all users, disrupting workflow.
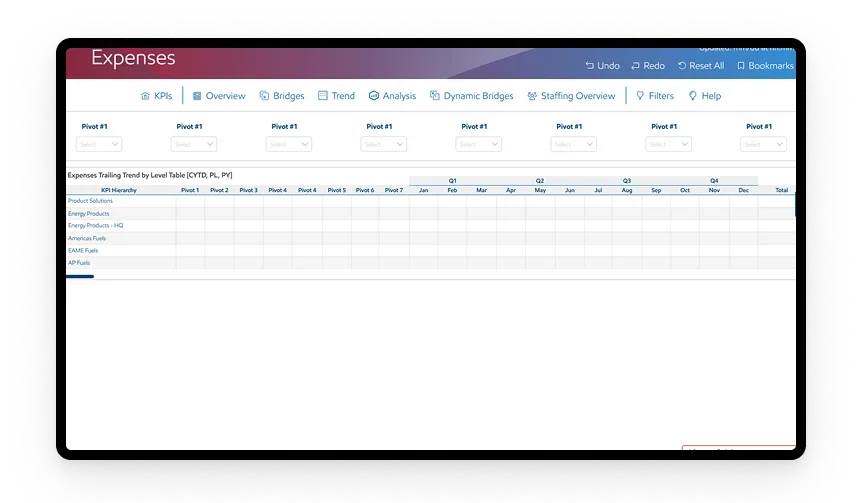
Wireframes
Wireframes
A wireframe is a rough schematic created in the early stages of digital product design to help visualize and communicate the structure of a product or website.
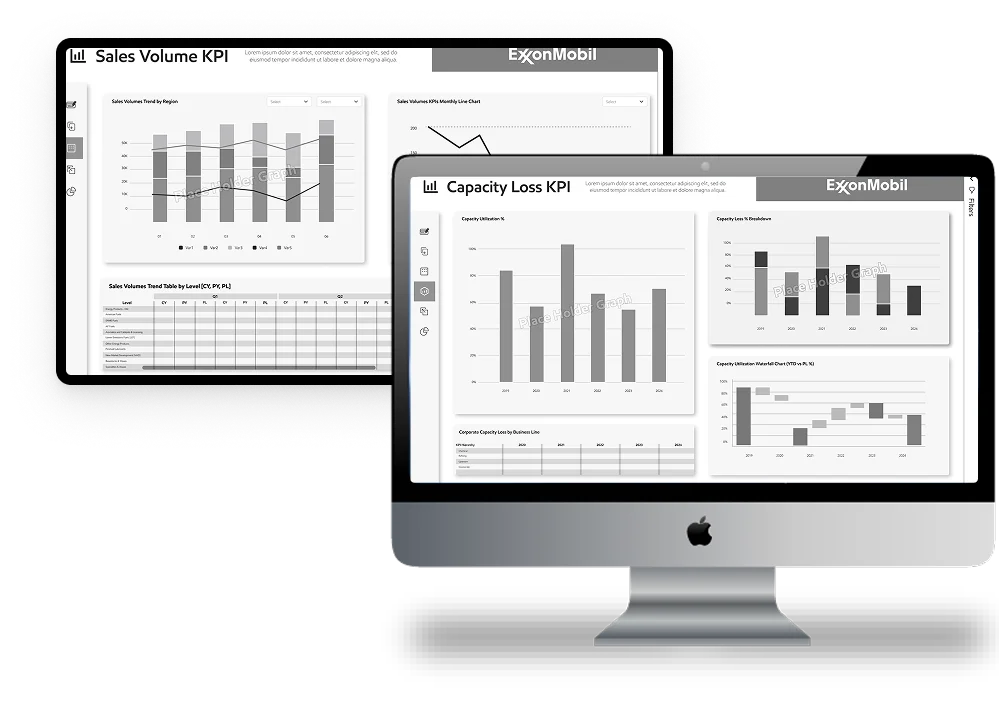
Wireframes
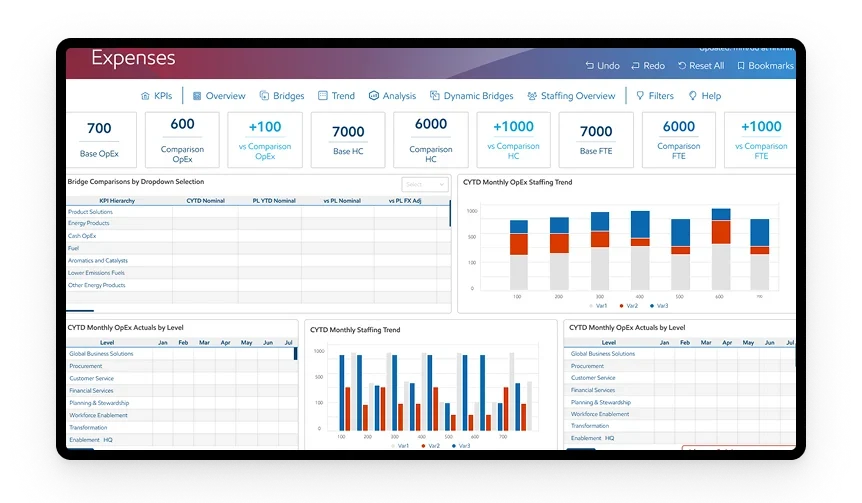
Staffing Overview
User Age
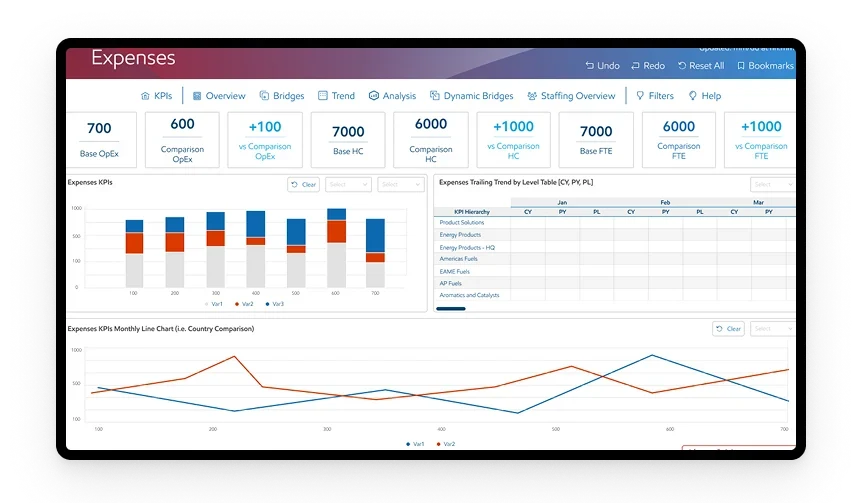
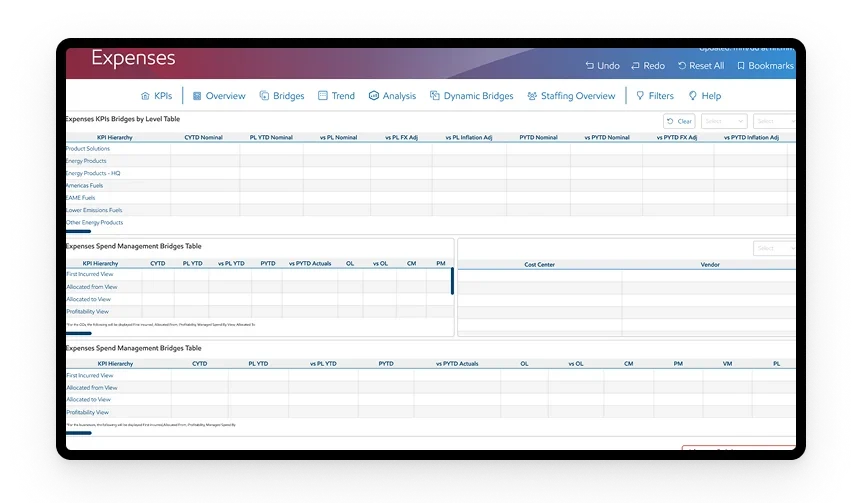
Wireframes
Bridges
Analytics
User Interface
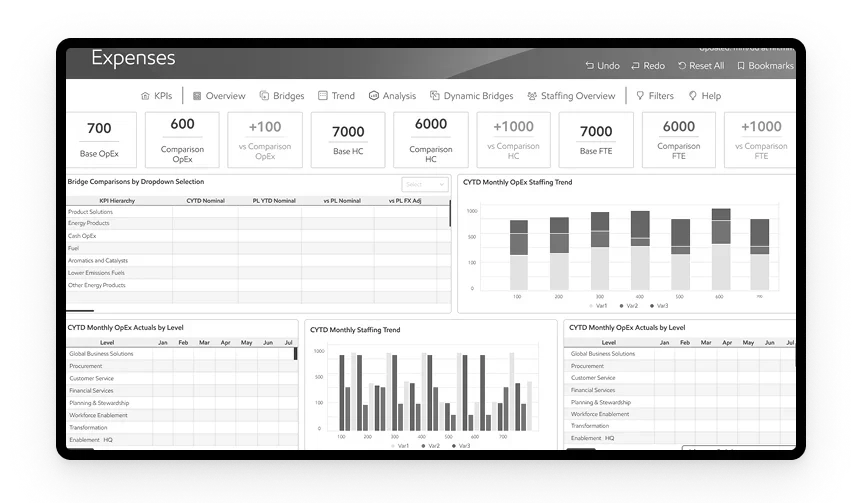
User Interface
User interface (UI) design is the process use to build interfaces in software or computerized devices, focusing on looks or style. Our aim to create interfaces which users find easy to use and pleasurable.
User Interface
Staffing Overview
User Age
User Interface
Bridges
Analytics
Thank You
To Connect with Us.
Wanna collaborate?
Let’s chat.
Name
(required)
Hey, thanks for checking out my work.
I’ve been fascinated with the way people interact with technology since forever. I’m particularly keen on digital products designed to make life easier for human beings.
What are you working on?
If you want to know more about my design process, or if you want to talk about a cool idea, don’t hesitate to hit me up.